Tuesday, 27 May 2025

Big Data recap

 Big Data Recap 

 Week 10 (27/05)

 With all the research and infromation gathering which i have done it has given me a clearer picture of the Big data Topic and all of its inner Workings on how big data can effect multiple ascpects of life from healthcare, education and government, But also how big data is used by companies to  increase profits, find out what customers/subscribers like and want and to even how big data has been used negativly. I like to say thank for following me along with this blog.


Big Data outcome Part 2

 Big Data outcome Part 2

Week 9 (19/05)

 
This is the final Week of my big Data Blog Where it will go over the Last Topic which is Topic 21: Applications of BIG Data techniques to a problem. This last topic will cover the sub topics of Designing profitable creative content and designing targeted advertising.
 

Topic 21

Applications of Big Data  techniques to a problem


As  My search about netflix in the previous topic 18 Big Data and Netflix go hand in hand, This topic will go indepth about how netflix truely uses the big data. How they started, their own original series and how they've used their big data to help them prosper.


History of netflix

Netflix started as a similar business to BlockBuster which being a dvd rental company But what seperated Netflix from BlockBuster is their methods, while blockbuster was a in person video rental store where people could look at their stock rent a dvd and had to return it by a specific date, Netflix on the other hand had decided to go with a subscription based model where customers would subscribe pick a DVD and have it mailed to them.Before 2007 Nexflix had offered to block buster 50 million dollars to buy them to get a jump start in the online video streaming platform as they were hemorrhaging more money than they had but blockbuster had declined the offer. One of many blunders which pushed block buster futher into their quick spiral into bankruptcy.


Netflix Originals 

Netflix uses its big data analytics when creating their own original shows or series. The biggest case of Netflix using big data for its shows its the american remake of house of cards. House of cards originally a british TV series hosted on BBC 1 which was a political drama. Netflix had seen the success of the UK version and had decided to risk it an make an american version of it. Which had costed over 100 million dollars which was a big risk for netflix. Using big data netflix had used their analytics to know that alot of their subscribers had watched the orginal version and that had also liked watching movie with kevin spacey as the protagonist so netflix using this data had put kevin spacey as the lead role in the series  which lead to the series getting 6 seasons.


 How netflix uses  Big data to push futher

 As shown Topic 18 Netflix uses Big data analytics They use their analytical data to determine what their subscribers do, this can include pausing and unpausing,skipping parts of a show,stop watching a showm skip an episode of a show, ratings, search, scrolling and even what device your watching the show from. all this analytical data helps netflix determin what works for them and what doesn't. by using this data netflix can focus into a specific area which can get them money 


designing target advertising

 Designed targeted advertising is a method of targeted advertising which uses big data analytics and sources to target specific individuals with advertisments which shows things which they might like, might of bought or searched for but didn't buy all in a veign to get users to click on the ads. Many companys use Targeted advertising But for this Blog I will be focusing on how facebook uses designed targeted advertising, facebook has multiple methods of analyzing user data these methods include


Tracking Cookies

 Tracking Cookies allows for Facebook to Track its Users across the web, Once a user logs in they can track what they are doing, so if a user is also browsing on other sites facebook can use these cookies to figure out what sites their on and start to gather a data base on what the user likes to then use that data to do targeted advertising
 

 Facial recognition

 A more recent investment facebook has made is in the facial recognition and image processing fields, this allows facebook to track users across the internet and on other facebook profiles with its image recognition system which is provided via user sharing,


Tag suggestions

 Facebook allows users to tag in photos aswell as suggests people to tag which uses its facial recognition software along with its image processing
 

Like analyzing 

FaceBook uses Posts Likes to catagories information from its users as a study from cambridge university found out that the pattern of facebook likes can accurately predict users sexual orientation, statisfaction with life, intelligence, emotional stability, religion, alochol and drug use, relationship status, age, gender, race and even politcal views.
 
https://www.cam.ac.uk/research/news/digital-records-could-expose-intimate-details-and-personality-traits-of-millions


 Downsides

 
With facebook harvesting so much data from its user is its privacy converns. As users don't know how or what truely facebook is doing with their data. As facebook has had many mishaps with users datas


Monday, 19 May 2025

Big Data Outcome 4 Part 1

Big Data Outcome 4 Part 1

 Week 8 (14/05)


This is the Start of the final couple of weeks of this blog in which i collect my findings about the HND Big Data Topics. The topics which will be Talked about in this first part of outcome 4 is, Topic 18, 19 and 20 which each respectivly are. Types of problems suited to Big Data Analysis, Data mining methods and Types of visualisation


Types of problems suited to Big Data Analysis

 Big Data exels a helping solve specific problems in many different sectors of organisations from marketing, education to travel and transport there are many areas where big data can help improve these fields. This section of the blog will be going over problems which big data analysis help solve for each of the sectors mentioned above.


Marketing

 Big data analytics is a vital area for companys to help understand what their users are doing and want at a givin time, i Will be using two examples of how companys use Big data analytics to their advantage these companys being Netflix and Mcdonalds.


Netflix 

 Netflix generates billions of data per second from its over 150 million subscriberes and stores the data from them. The data created they use big data analytics to track what their users do while on the netflix app/website these include what shows people watch, when they are watching it, what device is currently watching it on, if they've paused the show and how quickly they finish watching the show, They can use all this data to tailor make the netflix website by creating custom user profile which shows the user things they might want to watch be it tv shows, movies or animated shows. This video explains how  netflix uses big data analytics


Mcdonalds

 McDonalds is another example of companies who use big data to tailor their user experience, mcdonalds collects information from their users through their mobile app, drive through and their electronic ordering displays in person, This lets users store loyatly points when buying things through those methods which makes customers use those points which generates more data to analyse. Through all this data generated they use it to compare to different factors these factors can include the weather, the time of day and events which are held near by.


Education

 Big data analysis also helps in the education sector as this allows the Educational department help improve the learning experience and teaching methods. 


 improve pupil Learning experience


the pupil Learning experience as Big Data analytics can help improve figure out where students need. an example of big data being used in the education section for helping students learn is Sparx, which is a maths app company used by school kids to help them learn maths by using machine learning, personalized content and data analytics.
 

 improve teaching methods.

 As Big data can improve the pupil learning experience it can also improve teaching methods for teachers. Teachers can use Analytics apps to help gather childrens habits from reading to wrting which can help teachers where they need help the most. With this data teachers can help group kids together that have the seam learning needs and helps them target key issues. This encourages teachers and educators to think and reflect on their teaching methods if multiple students have the same issue.


Travel and Transport

Big data improves the Travel and Transport sectors by letting companies figure out the best way to optimise the data used from the two sectors these being, Big data and city Mobility and Big data and the airline industry.


Big data and city Mobility 

 Big data analytics also helps city mobility as has created mobility methods ranging from car hire companys, E-bikies rentals and bus companys. Companys like Uber are a shining example of big data useage in analytics. as they can use the data they generate and store to use to get their customers to Point A to B the quickest time. Uber also uses this data to predict when the service is the most busiest, which lets them set prices acordinly


Big data and the airline industry

 Big data analytics can be used for planing routes, by checking the up coming weather paterns which coudl effect flights. Airline companys like boeing also use big data with their own airplane health management system which gathers data everyday from millions of measurements across their airline fleet. This allows boeing to predict potential issues and failures, which means they know exactly when to fix their planes without constantly spending money on maintenance.


Data mining methods

 This section will Go over the information which i have found about Data mining, give a quick introduction to data mining and what are some methods of data mining. Data mining is the process of sorting large data sets to help find patterns and relationships which helps businesses to solve problems and predict future trends. The four Data mining methods are Regression analysis, Association Rule Discovery, Classification and Clustering


Regression analysis

The simpliest form of Data mining, Regression analysis is used to predict the value of something based on the value of other features within a data set. Regression analysis can be used to predict a products revenue based on similar products or predicted stock mark status.


Association Rule Discovery

 Association Rule Discovery looks for common relastionship between purchased items. This helps Analyists figure out what to recommend with each other. an example can be Computer parts be it a CPU and a cooler.

Classification 

 Classification is a method of data mining which assigns items in a group to specific categories or classes, by grouping items in a group is to more accurately predict the class for each item in a data set.

Clustering 

 Custering will cluster objects into a group so items in a specific object will not be similar to ones outside the cluster. An example of clustering is custering customers together to make effecient marketing strategies.


Types of visualisation 

Data visulisation is the method of visualising sets of data by putting them in something understandable examples of this include bar charts, line charts, pie charts and scatter charts.Data visualisation Works with datasets which are Massive this allows companys to sort it into groups to help which helps them figure out, understand and manage massive datasets and how they can be effective in helping their companies
 
 
There are a variaity of tools which can be used to help in processing raw data sets and transforming them these include Google Chart, Tableau and even microsofts own power BI, These tools allow companys to turn raw data into processed data via graphical visualisation. Programming languages  Such as Python and Javascript also allows graphic visualisation.


Monday, 12 May 2025

Big Data Outcome 3 Part 2

 Big Data Outcome 3 Part 2

Week 7 (11/05)

This Week will Go Over things which i have found which correlate With the New two Big data topics which being Big Data Topic 16 and 17 which are big data implications in society and Strategies for Limiting the negative Effects of Big data


Topic 16

Big Data implications in Society

Big data impact every Sector in Society From healthcare, business to Politics enabling decisions and interest easier to look at and understand but it can also be used in harmful ways especially politics which is what Will be focused on at this Blog Page.


Good impacts in Politics

The impacts for Good with Big data used in Politics as Using Big Data when running from a position of Power and by smartly using the data From Big data to target specific Groups  Can increase the chances of Winning. An example of this is from Barack Obamas 2012 re-election campaign As his team had noticed that Obama's quick donate program had gotten 4 times more donations that regular donators and his team used this to their advantage and eventually manged to raise 1 billion USD. Continuing this Barack's team kept using Big data to increase awareness for his campaign by using methods as Advertisements outside of the news stations such as on the internet and had also held Q&A sessions on websites such as Reddit. All of this combined with Big data lead Obama to win the re-election in 2012. These websites go more in-depth if you wish to read more about it

https://www.technologyreview.com/2012/12/19/114510/how-obamas-team-used-big-data-to-rally-voters/
https://www.scmp.com/yp/learn/college-uni-life/university-programmes/article/3071524/how-data-analytics-helped-obama-win


Bad Impacts in Politics

Just as There are positive impacts of big data, There can also be negative impacts of big data. As big data Can only do good if in the hands of people who wish to help and advance people. But what happens if big data reaches the hands of a malicious person This is what this section will go over and cover Two Events which Big Data was used in a negative way These Being the  Data gathering in the Netherlands by the Nazi's before the holocaust and the  Internment of Japanese-Americans in World War 2

Data gathering in the Netherlands by the Nazi's before the holocaust

Before Nazi occupation the Dutch Government Had created a system to have a registration system which was used for administrative and statistical Purpose which helped the country know of all the people in the country from birth to death. But when the Nazi's took over the Netherlands they had used this system which was created from big data and twisted it and reused the Data and created a registration system which contained the Dutch Jewish and Roma people who lived in the Netherlands which would then be used to find Jewish and Roma people to send them to the holocaust camps.


Internment of Japanese-Americans in World War 2

It was Found out that the U.S had used their Census Bureau had given their Census information to the U.S Secret Service which had Data from the 1940's which was used to Identify people of Japanese Ancestry which helped the U.S Gather and Round up Japanese-Americans to hold in Imprisonment camps in California and six Other states during World War 2. 


Topic 17

Strategies for Limiting the negative Effects of Big Data

There have been many laws and regulations which have been created and updated which help prevent to limit the negative effects of Big data Such as the General Data Protection Regulation (GDPR) created by the European union to help protect the data of European citizens + united kingdom citizens, It was created in 2016 and fully adopted in 2018.


The General Data Protection Regulation (GDPR) is a set of laws which helps governments to penalise and fine company's who mis-use personal data or who are not transparent what they use it for. If a company does not comply to the GDPR laws they can be find up to £17.4 million pounds or 4% of the company's global annual turnover

GDPR effects Every citizen Under the GDPR's reach by ensuring that company's follow the legislation requirements by making their privacy policy's clear for the users. Under the GDPR users can request a company the information which their holding about the user. Company's have a strict 30 day deadline which the information should then be sent to the user who requested it, Companies are also not allowed to charge the User to see their requested information under the GDPR regulations

After the UK left the European union the Uk had created the Data Protection act 2018  which uses a lot of the same frame work which was used in the EU's GDPR So company's which break the GDPR framework would also break the UK Data Protection Act 2018 guidelines if the company operates within the united kingdom.

These videos Go over the GDPR and UK DPA 2018

https://www.youtube.com/watch?v=I-VuonciKWk&pp=0gcJCfcAhR29_xXO


Wednesday, 7 May 2025

Big data Outcome 3 Part 1


Big data Outcome 3 Part 1


Week 7 (07/05)

This Blog will Cover The first Half of Outcome 3 which will go over my findings of  information which i have found interesting from the First Two topics of Limitations of predictive analytics and Implications of Big Data for individuals, Topics 14 and 15 respectively 


Topic 14

The Limitations of predictive analytics Uses Historical data, Statistical algorithms and machine learning Which they use from gathering all the data from the areas to predict possible future events by looking at the past and comparing sources to decide wither or not something might happen,  The limitations of predictive analytics can be split into 4 key areas 


1. Data quality and availability


As data sets get larger from harvesting data, the quality of the data and availability of the data  is important when using predictive analytics. As when collecting data from all a cross the internet the quality of the data can vary resulting in missing value or inconsistencies. 


2. model complexity and interpretability


Model complexity and interpretability ever increasing, it can make predictions complex and hard to understand and interpreter the  points making the prediction. Which makes it difficult for companies.


3.Temporal dynamics and changing patterns


With big data constantly generating new data sets with ever evolving information, predictive analytics so the increase of historical data increase but as the future is inherently uncertain the prediction can quickly become incorrect or outright not close to what real outcomes would be 

4. ethical considerations and privacy concerns


    The ethical considerations when using predictive analytics could raise ethical concerns as the data it uses to train on could incur bias and discrimination if the data it trains on is bias or a discriminatory in factor,  With predictive analytics there is always a concern about privacy is if a persons data is getting used without their consent.

Topic 15


Topic 15 is about Implications of Big Data for individuals which goes over privacy concerns of Big data analytics on an individual person and how it could effect them. Implications of Big Data for individuals can be split into 2 areas of concern for the person who's data is being analysed these points being Data collection and consent, Data profiling and discrimination.

Data collection and consent

With data constantly being generated by individuals every second, it could create significant privacy concerns if Users found out how much of their actions on the internet create data which is then harvested and put into data analytic predictions without their consent

Data profiling and discrimination

Big data can be trained to profile individuals based on their behaviour, preferences and other personal attributes. which if this analytics is being feed bias and discriminatory data sets it can cause the AI to unfairly profile individuals based off things like stereotyping which can lead to bias in important areas like employment or insurance. 


This page i found interesting  and goes futher in depth about Implications of big data on individuals
https://www.linkedin.com/pulse/implications-big-data-privacy-concerns-intelligentautomationcompany


Tuesday, 29 April 2025

BIG data Outcome 2

 Big data outcome 2


Outcome 2 out will cover Topics 9-13

Topic 9-11

9.contemporary applications of big data in business
10.contemporary applications of big data in science
11.contemporary applications of big data in society


9.the contemporary applications of big data in business has many use which pushes company's to invest further into big data applications and analysis some of these uses include Targeting customers or potential customers by learning their behaviour and preferences via social media, browsing log, text analytics and sensory data from smart watches with this businesses can increase the amount of data they can analyse to get the most accurate information, another use is for financial trading using big data allows businesses to determine the best  buy and sell trading stocks


10.The contemporary applications of big data in science allows for improved health care by using big data analytics allows us to analyse DNA strings within minutes, which can enable us to find new cures, predict and understand new diseases quicker, another way big data is used in science is improving science and research capabilities which allows us to further our scientific knowledge an example of big data in the scientific field getting used is CERN, CERN's data centre has 65000 processors to analyse 30 petabytes of data.


11.Contemporary applications of big data in society allows for towns, city's and country's to help keep their places safe by increasing the amount of security via law enforcement they have by using big data they can use analyse patterns to figure out crimes before they happen by searching peoples searching habits, GPS[ location and health. Big data allows the improvement of cities and countries by optimising traffic flow based on real traffic from big data, Cities can analyse patterns to help improve the daily lifes of their citizens


Topic 12-13

12.future applications of big data
13.technological requirements of big data


12. Future applications of big tech will effect contemporary application of big data in business, science and society. As tech evolves big data analysis becomes quicker and easier to process mass quantity's of data using thing such as AI/AL and quantum computing allows for company's to funnel large quantities of data analysis within minutes or days. This allows businesses to analyse patterns quicker which helps them target potential or existing customers. The future applications can help Science by increasing the amount of data analysis which is done which can help scientists discover cures quicker and give more accurate diagnosis, future of big data can help society by helping law enforcement by catching criminals before they commit crime, increase the happiness of citizen by analysing the data from the citizens to figure out what needs fixed. 


13. As big data increases the total amount of data it gets so does the technological requirement increases
As bigger quantities of data must be stored the storage requirement also needs to grow but its also important that the storage does not have any faults such as data loss and corruption this means that big data storage must be backed up to ensure that if there are any loss it is backed up. parallel processing is an important part of big data analysis as parallel processing splits up processing power between two or more pc's which makes analysing large data sets much quicker.


Monday, 28 April 2025

BIG Data outcome 1

Big Data Outcome 1

Topic 1-4


This blog will go over the first Outcome For The Big Data course which is 1 to 4 in the introductory page these topics will are

  1. definition of big data
  2. historical development of big data
  3. growth of data 
  4. reasons for the growth of data

1.Definition of big data is the term used to describe a large amount of data which is beyond the human  ability to traditionally process it with tool, Big data is used to analyse patterns, trends and relationships which is then used to analyse how someone might behave either on the internet or from information that has been gathered like if the person went to jail and the likely hood that they might reoffend. Big data is classed as three main data sets these being Structured Data, Semi-Structured data and Unstructured data 

Structured data
Structure data is a classification of data which can stick to a already existing data model which makes Structure data the easiest of all the classifications to analyse. Structured data adjusts to a table data set with its rows and columns which can be used by app like excel or SQL databases. 

Unstructured data
Unstructured data  is data which doesn't conform to traditional data models or sets. Unstructured data is usually text heavy but can include data sets which has dates, numbers or facts. this causes data sets to have a lot of irregularities and ambiguities when looking at them which is why its called unstructured data.


Semi-structured
semi structure data is a data set which does not conform to the usual structured or unstructured data sets but contain tags or other markers to help separate elements and enforce hierarchies . Examples of semi-structured data include JSON and XML files which are both semi-structured data sets. Semi-structure data exists because it is a easy middle ground between the structured data and the hard to read unstructured data.  


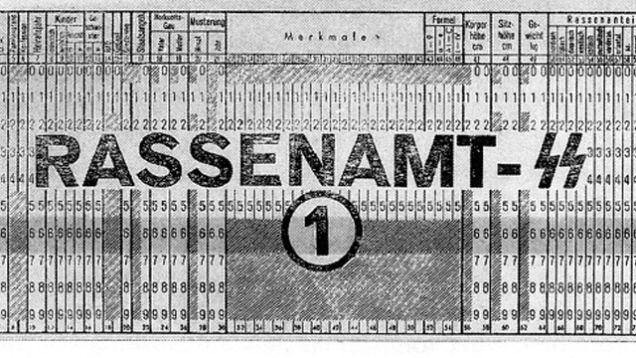
2.The term Big data has been used the 1990's. Big data has been used through out the centuries to try  and analyse possible trends or decisions. Its important to realise the techniques which where used and evolved into the modern day techniques that current big data analysts use, until the 1950's 90% of data analysis was manually done and written on paper, After the 1950's data analysis was slowly swapped to computers compiling mass data sets which computers could analyse terabytes of data in seconds, as the internet grew the amount of data grew as well, The total amount of data has grown past human comprehension as the total amount of data generated in 2013 was 4.4 zettabytes and has ten times since 2020 going from 4.4 to 44 zettabytes.

3. The growth of data has increase exponentially since its inception in the 1990's. The growth of data can be split into three phases which conform to every step of the internets growth, Big data phase 1.0 was the first phase in the big data phases, where it relies heavily on storage, extraction and optimization techniques which are used commonly in relational database management systems, Big data phase 1.0 provides the foundation of which big data is used today as it uses techniques which would be common place in phase 3.0 such as database queries, online analytical processing and reporting tools. The second phase of big data, big data phase 2.0 started at roughly the 2000's as the growth of the internet and web started to show unique ways of data collection and analysis, Company's such as yahoo and amazon started to collect and analysis customer behaviour. HTTP web traffic introduced a massive increase of unconventional data forms such as semi-structured data and unstructured data sets. With these new datasets company's needed to find new ways and increase storage solutions to deal with these new data types. The current phase which big data is on is 3.0, with the advent of mobile devices mass adoption it gives company's more data to analyse along with the usual click and search data but also gives company's a new data set which is GPS location data, it gives company's the ability to track your movement physical behaviour and even health related data. with the advent of sensor based internet devices the data generation increases exponentially as internet of thing devices (IoT) like TV's, Smart assistants, thermostats and wearables collect zettabytes of information daily it means that company's have a new way to analyse data sets. 

4.Reasons for the rapid growth of big data include the aggressive acquisition and permanent retention of data with data sets becoming so massive. Along with the growth of big data the cost to store all that data has decreased while the total amount of data which can be stored has increased, another reason for the growth of big data is the rapid increase of business analytics which the market for business analytics is higher than 100 billion dollars. Security is another reason for the rapid growth, as company's get bigger they harvest more security data which include audio, video surveillance and system data logs which can all be analysed by big data. The increase of Internet devices such as phones and tablets increases demand for data analytics, with the growth of the cloud it allows company's to store more data cheaper.


Topic 5-8

5.Value of data(including future value)
6.Traditional statistics(descriptive and inferential)
7.limitations of traditional data analysis
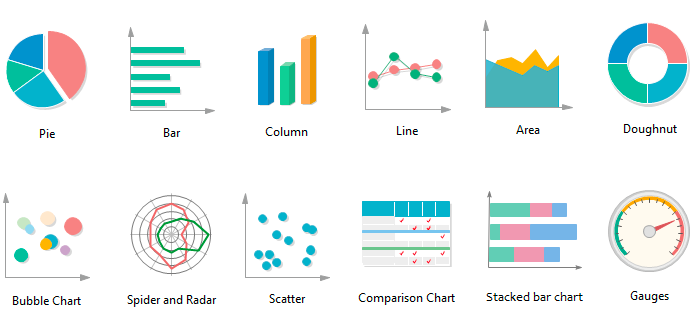
8.characteristics of big data analysis(including visualisations)


Value of data
The value of data describes the impact, insights or benefits which is gotten from analysing. The value of data measures how effectively data is used to drive business outcomes and help improve decision making and optimize processes. The value can be split into three sections Statistics, business and general. Statistic, the value of data is content which fills out a table space these could include numbers or words. In business, data values refer to the total measurable financial impact of how it applies to an organisation and in general it refers to the benefits and advantages that can be used from data these decisions include innovations, services and security


Traditional Statistics 
There are two types of traditional statistics which are used in Big data these are Descriptive statistics and inferential statistics. Descriptive statistics describe data, descriptive give information which describes data in a very accurate manner, a complete information data set is provided Descriptive statistics might not be able to extended to another group. Inferential statistics Studies a sample of the same data. Inferential statistics can be extended to a similar large group and can be represented by a graph.


7.With the constant increase of data growth from new devices coming the requirement to analyse the data increases, traditional data analysis relies on structured data which is organized with specific methods such as surveys, questionnaires and other forms of data collection, as other forms of data such as unstructured can give more valuable data to businesses, traditional data analysis methods are also time consuming when dealing with tons of data, an example is a survey can take months to complete which then needs to be analysed. Limited accuracy is another issue which faces traditional data analysis as it can be prone to errors and inaccuracies


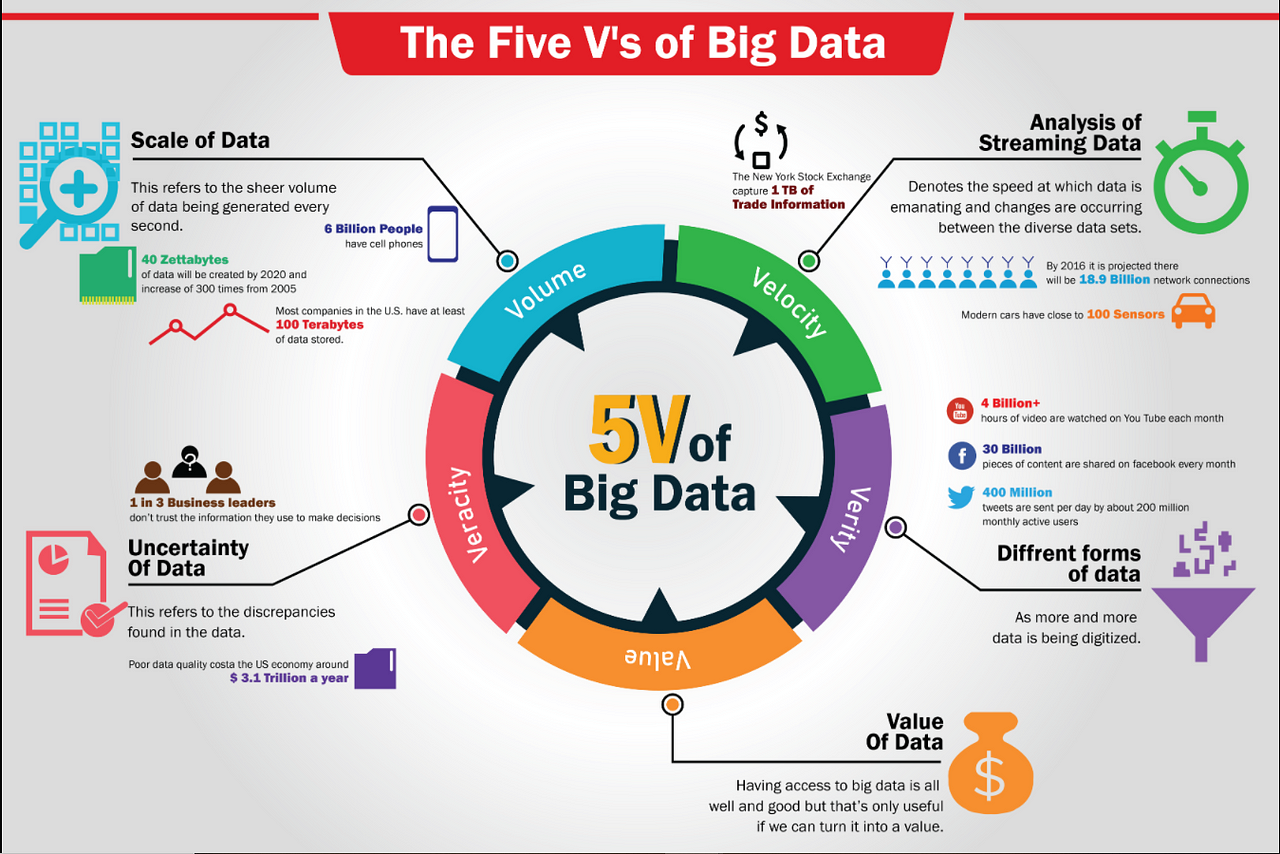
8.The value of data  can be split into 5 V's these 5 V's are Volume, Velocity, Variety, Veracity and value  each V describes a different characteristics used in big data, the first Big V is Volume, volume dictates the amount of data which exists, Its is the initial size and amount of data which is been collected and stored. The next Big V is Velocity, velocity is characterized on how quick that data is being generated So that business can make the best possible decision for their businesses,(add more if needed), The third V is variety, This refers to the diversity of data types which an organization would collect from different data sources these data sources might vary in value. The verity of data includes structured, unstructured and semi-structured data (more), the forth V is veracity, Veracity is the quality, accuracy, integrity and credibility of data which has been gather. Data could have missing pieces, be inaccurate or might not be able to show real insight, This is where veracity comes in where it shows the level of trust in collected data. The last V type is Value, Value refers to the benefit which can be gathered from all other of the 4 V's and big data which is provided and can be used.


Big Data recap

 Big Data Recap   Week 10 (27/05)  With all the research and infromation gathering which i have done it has given me a clearer picture of th...