Big Data Outcome 4 Part 1
Week 8 (14/05)
This is the Start of the final couple of weeks of this blog in which i collect my findings about the HND Big Data Topics. The topics which will be Talked about in this first part of outcome 4 is, Topic 18, 19 and 20 which each respectivly are. Types of problems suited to Big Data Analysis, Data mining methods and Types of visualisation
Types of problems suited to Big Data Analysis
Big Data exels a helping solve specific problems in many different sectors of organisations from marketing, education to travel and transport there are many areas where big data can help improve these fields. This section of the blog will be going over problems which big data analysis help solve for each of the sectors mentioned above.
Marketing
Big data analytics is a vital area for companys to help understand what their users are doing and want at a givin time, i Will be using two examples of how companys use Big data analytics to their advantage these companys being Netflix and Mcdonalds.
Netflix
Netflix generates billions of data per second from its over 150 million subscriberes and stores the data from them. The data created they use big data analytics to track what their users do while on the netflix app/website these include what shows people watch, when they are watching it, what device is currently watching it on, if they've paused the show and how quickly they finish watching the show, They can use all this data to tailor make the netflix website by creating custom user profile which shows the user things they might want to watch be it tv shows, movies or animated shows. This video explains how netflix uses big data analytics
Mcdonalds
McDonalds is another example of companies who use big data to tailor their user experience, mcdonalds collects information from their users through their mobile app, drive through and their electronic ordering displays in person, This lets users store loyatly points when buying things through those methods which makes customers use those points which generates more data to analyse. Through all this data generated they use it to compare to different factors these factors can include the weather, the time of day and events which are held near by.

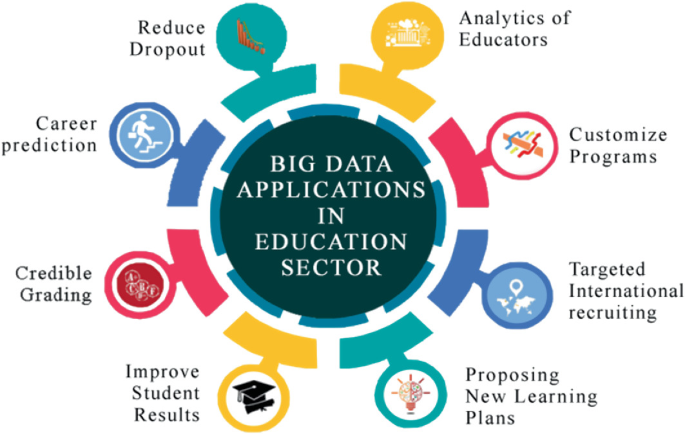
Education
Big data analysis also helps in the education sector as this allows the Educational department help improve the learning experience and teaching methods.
improve pupil Learning experience
the pupil Learning experience as Big Data analytics can help improve figure out where students need. an example of big data being used in the education section for helping students learn is Sparx, which is a maths app company used by school kids to help them learn maths by using machine learning, personalized content and data analytics.
improve teaching methods.
As Big data can improve the pupil learning experience it can also improve teaching methods for teachers. Teachers can use Analytics apps to help gather childrens habits from reading to wrting which can help teachers where they need help the most. With this data teachers can help group kids together that have the seam learning needs and helps them target key issues. This encourages teachers and educators to think and reflect on their teaching methods if multiple students have the same issue.
Travel and Transport
Big data improves the Travel and Transport sectors by letting companies figure out the best way to optimise the data used from the two sectors these being, Big data and city Mobility and Big data and the airline industry.
Big data and city Mobility
Big data analytics also helps city mobility as has created mobility methods ranging from car hire companys, E-bikies rentals and bus companys. Companys like Uber are a shining example of big data useage in analytics. as they can use the data they generate and store to use to get their customers to Point A to B the quickest time. Uber also uses this data to predict when the service is the most busiest, which lets them set prices acordinly
Big data and the airline industry
Big data analytics can be used for planing routes, by checking the up coming weather paterns which coudl effect flights. Airline companys like boeing also use big data with their own airplane health management system which gathers data everyday from millions of measurements across their airline fleet. This allows boeing to predict potential issues and failures, which means they know exactly when to fix their planes without constantly spending money on maintenance.
Data mining methods
Regression analysis
The simpliest form of Data mining, Regression analysis is used to predict the value of something based on the value of other features within a data set. Regression analysis can be used to predict a products revenue based on similar products or predicted stock mark status.
Association Rule Discovery
Association Rule Discovery looks for common relastionship between purchased items. This helps Analyists figure out what to recommend with each other. an example can be Computer parts be it a CPU and a cooler.
Classification
Classification is a method of data mining which assigns items in a group to specific categories or classes, by grouping items in a group is to more accurately predict the class for each item in a data set.
Clustering
Custering will cluster objects into a group so items in a specific object will not be similar to ones outside the cluster. An example of clustering is custering customers together to make effecient marketing strategies.
Types of visualisation
Data visulisation is the method of visualising sets of data by putting them in something understandable examples of this include bar charts, line charts, pie charts and scatter charts.Data visualisation Works with datasets which are Massive this allows companys to sort it into groups to help which helps them figure out, understand and manage massive datasets and how they can be effective in helping their companies
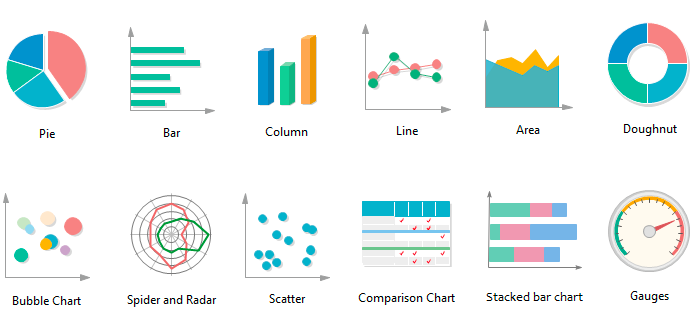
There are a variaity of tools which can be used to help in processing raw data sets and transforming them these include Google Chart, Tableau and even microsofts own power BI, These tools allow companys to turn raw data into processed data via graphical visualisation. Programming languages Such as Python and Javascript also allows graphic visualisation.


Impressive, excellent material you provided for me to read.
ReplyDelete